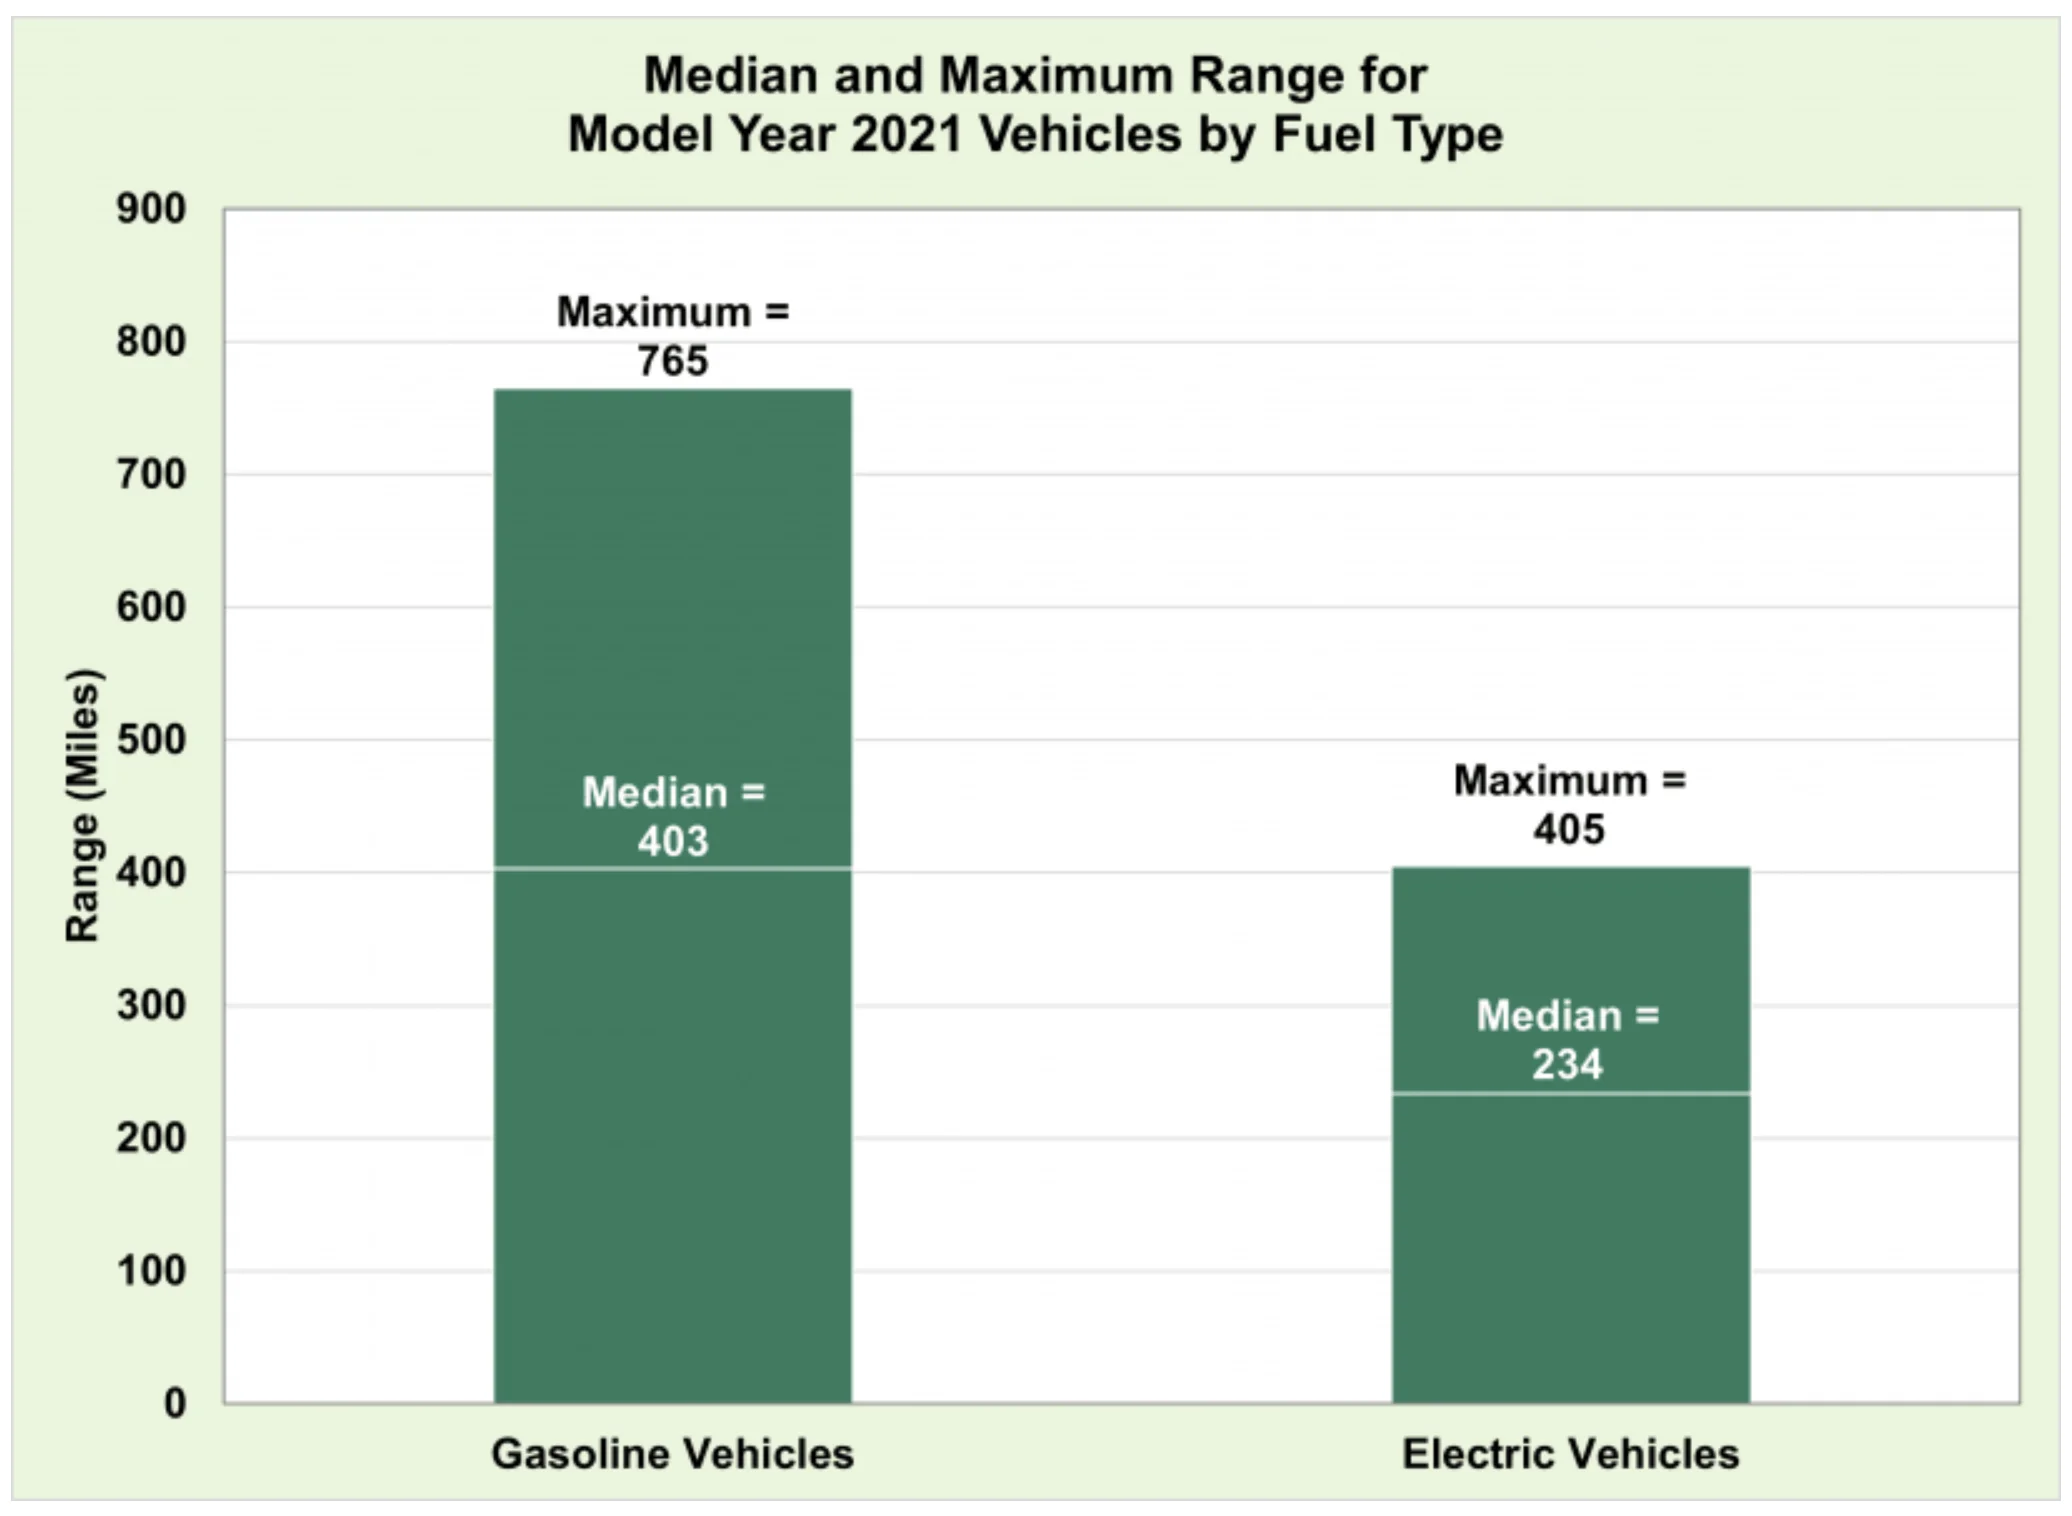
Efficiency and range are intricately linked, whether we’re talking about EVs or gasoline vehicles. When considering gasoline vehicles, though, range is often not a concern, primarily due to the long median range, the availability of gas stations, and the focus on vehicle efficiency over range. EVs, on the other hand, flip the script. Most consumers are entirely focused on range, ignoring efficiency, which is a significant contributor to EV ownership costs.
It is not uncommon to have several battery size choices when purchasing an EV. The 2024 Nissan Leaf, for example, is offered with a 40kWh or 60kWh battery. If we directly compare this to a gasoline vehicle, that would be like being offered multiple gas tank sizes. However, the major difference here is that an EV battery is a significant fraction of total vehicle cost, and gasoline vehicles only come with one gas tank size. More so, the gas tank is not a particularly expensive component.
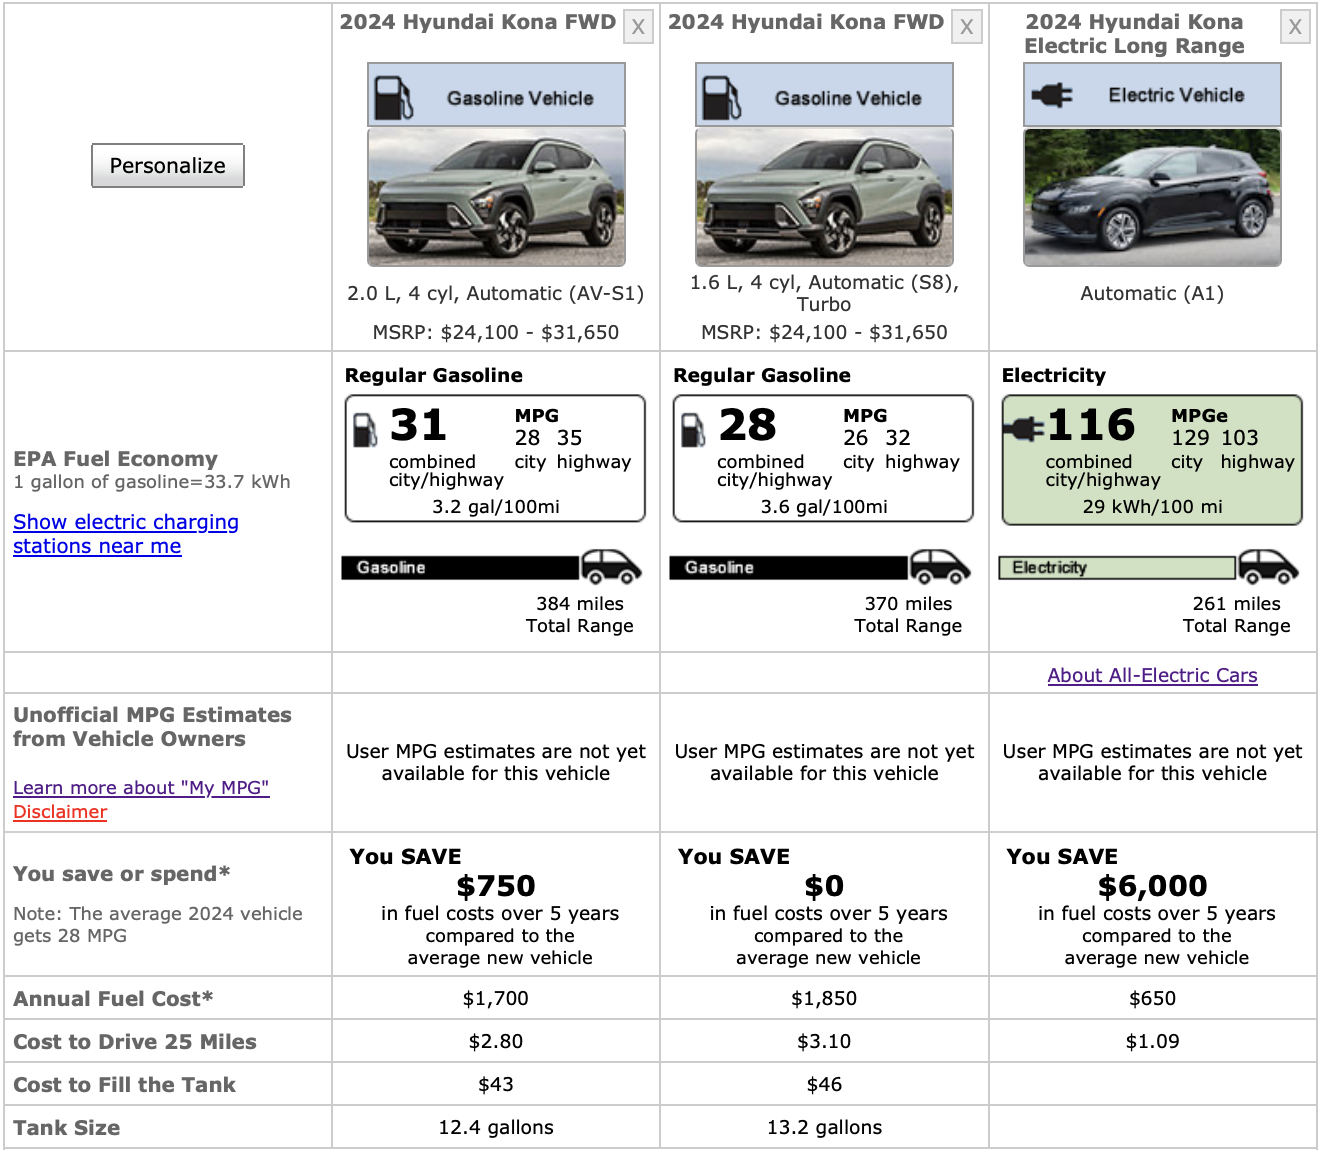
I’d like to offer a different perspective. Many manufacturers offer several engine choices. For example, the new Hyundai Kona comes with two choices: 147-hp 2.0L 4-cylinder engine, and a 190-hp 1.6L turbocharged 4-cylinder engine. Interestingly, the two vehicles do not share the same gas tank size, with the less efficient variant having a larger gas tank to increase the total range. Similarly, the BEV variant comes with two battery choices: 48.6kWh and 64.8kWh (note: only the long-range listed on EPA website as of writing).
Does Efficiency Equal Range?
Much like with two gas cars that have different engines, higher efficiency in an EV does not necessarily mean longer range. Some EVs, like the Nissan Leaf, are considered very efficient, with reports of 5+ miles/kWh, as you’ll see below. However, given the small battery size and very specific, efficient body design, the range is limited, preventing wide-spread adoption. On the other hand, some EVs are less efficient, yielding only 2 to 2.5 miles/kWh (e.g. Rivian R1T), but can still travel 300+ miles to a full charge because of a large, resource-intensive battery.
So why are we so obsessed with EV range? To put it simply - conditioning and routine. The average consumer has been driving gasoline vehicles with an average range of 300+ miles for decades, with little to no concern for gas station availability and reliability. Public EV chargers, on the other hand, can be few and far between, and reliability is mixed.
Although news headlines are dominated by stories of EV failing to deliver on their advertised range in poor conditions, EV forums are full of examples of owners reporting efficiencies and ranges far above EPA estimates. In this article, we explore the real-world data from two vehicles that participated in our Geotab data collection study: a 2015 Nissan Leaf S, and a 2021 Volkswagen ID.4 Pro S.
2015 Nissan Leaf S
Vehicle Model Specifications
EPA Range: 84 miles
MPGe: 126 city / 101 highway
Battery: 24 kWh 360V lithium-ion
Efficiency (est.): 3.50 miles/kWh
Curb weight: 3243 lbs
Details for Specific Vehicle Studied ("My Car")
Operational summary:
- Vehicle operated on an island with maritime climate, minimal seasonality changes
- Max highway speed is 50mph
- Hilly terrain but no mountains
Data summary:
- Lower median real range than EPA
- Higher efficiency than the other 8 cars in the cohort, exceeding EPA estimates
- Less seasonality in range
As of early 2023, the average EV efficiency (based on a sales-weighted average of new EVs) is 3.4 miles/kWh, making the Nissan Leaf an above average efficiency vehicle. These figures are based on EPA-determined efficiency, which often do not align with real-world data, particularly in the case of EVs that are primarily used for commuting and short city driving. The EPA efficiency tests blend city and highway drive conditions, so cars that are used only for short trips may see much higher efficiency. This is especially important for a vehicle with a range of less than 100 miles, as highway driving and long drives (highway driving) reduce efficiency. As a result, we often observe higher than expected efficiencies, sometimes greatly surpassing EPA estimates.
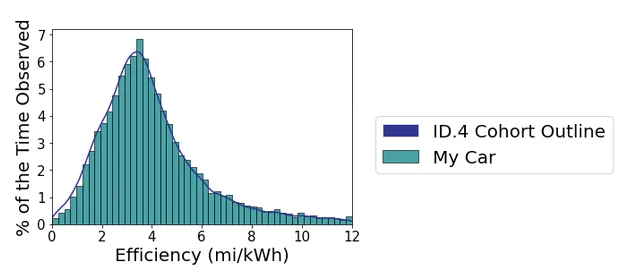
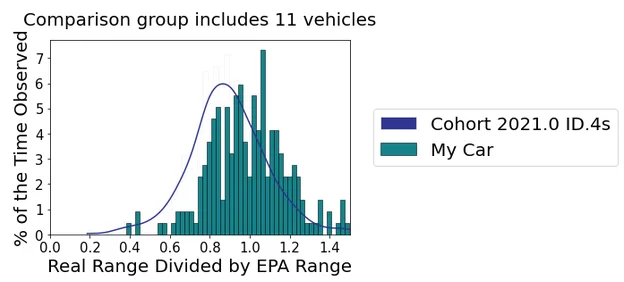
In the chart below, you can see the efficiency distribution for the entire cohort (line) compared to the individual vehicle ("My Car," bars).
.webp)
What the Distributions Can Tell Us
You’ll quickly notice that the distribution looks similar for both the cohort and "My Car," with all vehicles operating in the expected range most of the time. For the cohort, the most frequently observed efficiency matches up well with EPA estimates at nearly 3.5 miles/kWh. This implies that the EPA testing protocol is a decent predictor of normal LEAF driving habits.
For the specific high-efficiency vehicle that we’re looking at (“My Car”), the most frequently observed efficiency is 4.5 miles/kWh, a significant increase over EPA estimates and the cohort. Additionally, the top of the curve is much flatter, meaning that this particular car sees less variability (i.e. city vs highway, seasonality) than the rest of the cohort. For this driver, nearly 25% of driving is done at an efficiency between 4.5 and 5.5 miles/kWh.
One important distinction to make is the distribution skew. For the cohort, the data is a right (positively) skewed distribution, which occurs because probabilities taper off more slowly for higher values. This means you are more likely to see anomalously high efficiencies than anomalously low ones. You might expect to see such distributions for those cars driven in mountainous areas, where vehicles can obtain very high efficiencies when coming down from high elevations. Additionally, the right side of the curve closely resembles the chart obtained when we plot range as a function of speed, when only considering aerodynamics. For the individual, we see a slightly more symmetric (normal) distribution. This is what you might expect for someone living in a mild climate with relatively flat terrain.
In the next chart, we look at the real range as a function of EPA range estimates. At 1.0, the observed range and the EPA range are identical. This happens at 84 miles, as listed on the technical sheets. Looking at the entire cohort, we see that the peak of the distribution is at ~0.7, meaning the EPA range is higher than the range we observe. Similarly, the individual Leaf achieves a slightly lower than expected range, despite being far more efficient. The highest observed ratio is 0.86, or 86% of EPA range, with a distribution peak closer to 0.90, or 90% of EPA range.
.webp)
So why the difference? If you remember back to our article on Range vs Efficiency, you might remember that the two are linked by battery capacity, which is not a static number. Given that these vehicles are 8+ years old, they have been exposed to many charge/discharge cycles, and may have 100,000+ miles, so some battery degradation is expected. According to Geotab, the 2015 Nissan Leaf has an average degradation rate of 4.2%, primarily contributed to the passive air battery cooling.
As of the data collection period, we would expect a remaining battery capacity of 70-75%, or 17-18kWh (compared to 24kWh new).
Cohort: 17-18kWh x 3.5 mi/kWh = 59.6-63 miles / 84 miles (EPA) = 0.71-0.75
Individual: 17-18kWh x 4.5 mi/kWh = 76.5-81 miles / 84 miles (EPA) = 0.91-0.95
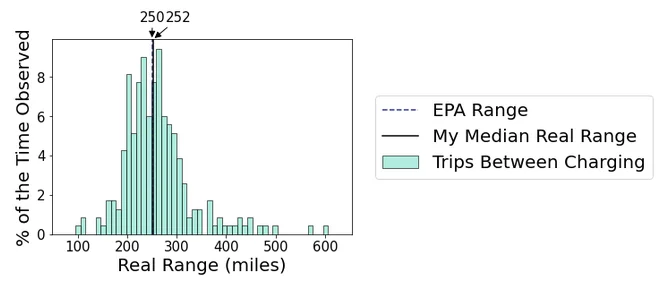
Based on these calculations, we can safely assume that all of the tested vehicles have experienced a fair amount of battery degradation, decreasing the total vehicle range. This is what we see in the Real Range chart, below. The EPA range is higher than the median Real Range for "My Car," suggesting that there is some range degradation. This is not surprising for an 8 year old car!
The next piece of data shows how far the vehicle was driven between charges. Here, we expect to generally observe a range below EPA estimates as drivers avoid running the battery to fully depleted. According to EPA range testing protocols, a fully charged Leaf with little-to-no battery degradation should be able to travel 84 miles under normal conditions. In fact, Recurrent observations suggest that many brand new LEAFs can actually exceed the EPA range estimates.
.webp)
In this right (positively) skewed distribution, we see that the owner often charges much sooner, likely maintaining a SOC above 20%, a good habit for EV owners that are cognizant of potential battery degradation. Occasionally, the vehicle is able to travel upwards of 100 miles between charges, likely under ideal conditions such as warm temperatures and short, low-speed commutes.
Note that this chart shows the estimated Real Range that the car can travel. Real Range is the average of the extrapolated real range (at 100%) distribution for a given 15 day window, as a function of average temperature. The distribution of real ranges is built based on the actual range driven between the end of a charging session and the beginning of the next charging session. For very efficient trips it is definitely possible to have an extrapolated real range that far exceeds the EPA range.
Finally, we look at how the car's Real Range, as defined above, fluctuates with temperature.
.webp)
As expected, lower temperatures result in reduced range, as efficiency decreases. These data indicate that this vehicle is sensitive to low temperatures, particularly when the temperature drops below 50F. This is likely due to cabin heating pulling energy from the battery.
2021 Volkwagen ID.4 Pro S
Specifications:
EPA Range: 250 miles
MPGe: 104 city / 89 highway
Battery: 82 kWh 240-400V lithium-ion
Efficiency (calculated): 3.05 miles/kWh
Curb weight: 4665 lbs
Details for Specific Vehicle Studied ("My Car")
Operational summary:
- Vehicle operated on an island with maritime climate, minimal seasonality changes
- Max highway speed is 50mph
- Hilly terrain but no mountains
Data summary:
- The efficiency distribution of this one car matches up pretty well with the cohort
- Its median real range is very close to EPA range (a bit higher)
- Good seasonality in range fluctuations
Compared to the Leaf, the ID.4 is much larger, heavier, and looks to have a less aerodynamic design - all of which result in lower efficiency numbers compared to the LEAF. However, the battery is much larger, allowing for a much longer range. Additionally, given the improved battery management system and the relatively young age of the ID.4 line, we expect minimal, if any, battery degradation.
In the chart below, you can see the efficiency distribution for the entire cohort (line) compared to the individual vehicle (bars). For both the cohort and the individual vehicle, the most frequently observed efficiency was 3.5 miles/kWh, exceeding the EPA estimate of ~3 miles/kWh. This is an unsurprising result considering the specificity of the EPA protocol, and the likelihood that manufacturers might underestimate range estimates. It may also reflect that EV drivers use their cars for shorter trips than the EPA expects.
Last year, the Edmunds ID.4 test observed a range of 287 miles with their in-house testing protocol, yielding an efficiency of 3.5 miles/kWh, matching our dataset. Once again, we observe a right (positively) skewed distribution, that indicates very high efficiencies are more frequent than low ones.
When we look at the real range as a function of EPA range estimates, we see that the cohort has a distribution peak at ~0.87, meaning the EPA range is higher than the range we observe. For the individual ID.4 ("My Car"), the highest observed ratio is 1.06, with a distribution peak closer to 1.03. This specific vehicle aligns very well with the EPA data, trending slightly higher than the cohort. The ID.4 is a relatively new vehicle, so battery degradation data is insufficient. Earlier this year, we published an article on battery degradation, which described an average degradation rate of 1-2% per year for EVs. Specific to the ID.4, anecdotal evidence suggests that the battery may degrade by about 5% per 20k miles. According to the Federal Highway Administration, US drivers average ~14k miles annually. 14k miles across three years yields 42k miles, and at 5% degradation per 20k miles we’d expect a roughly 10.5% decrease in battery capacity. This equates to roughly 3.5% degradation per year, a bit higher than we see on average.
Cohort: 73.39kWh x 3 mi/kWh = 220 miles / 250 miles (EPA) = 0.88
*Assumes average ~40k miles per vehicle at 5% degradation per 20k miles*
Based on these calculations, we can safely assume that all of the tested vehicles have experienced some minor battery degradation, decreasing the total vehicle range.
The next piece of data shows how far the vehicle was driven between charges and extrapolates the total range possible. The cohort data aligns very well with expected range. Several instances occur with range far beyond estimates, likely under ideal conditions such as warm temperatures and short, low-speed commutes.
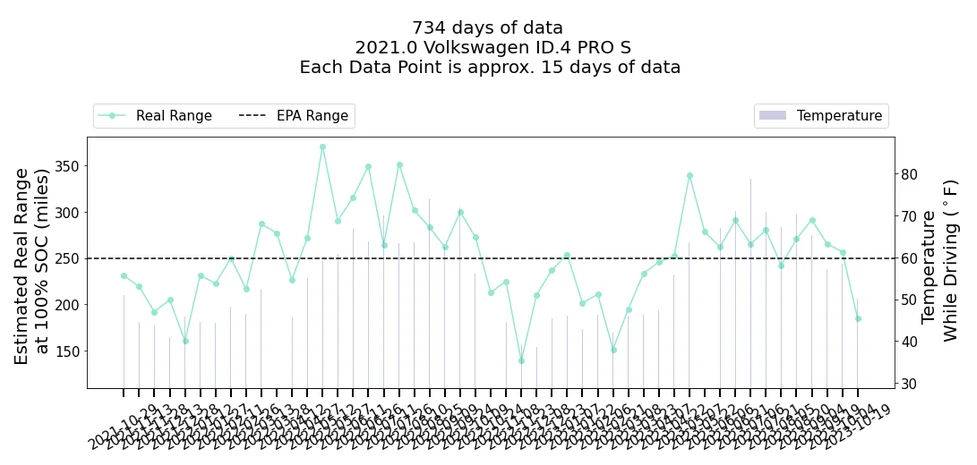
The final piece of data summarizes the entire data set, with each data point representing approximately 15 days of driving data, plotting estimated real range (at full charge) as a function of temperature. Once again, we can see that these vehicles respond directly to temperature changes, with lower expected range as temperatures decrease. At temperatures above 60F, the average real range exceeds the EPA estimates, sometimes by a large margin. However, at temperatures below 50F, we see a significant decrease in range, sometimes by as much as 30%.