Through the evolution of the automobile, the dashboard in many vehicles evolved from a set of analog gauges to a full LED display with touch screen controls. This is especially true for EVs, which are entirely digital and have no need for a mechanical fuel gauge. Plus, there is no longer any need to monitor engine RPMs, engine oil level, or operating temperature. Although more data can be obtained from a totally digital EV, the only necessary readouts are speed and remaining battery capacity/ range.
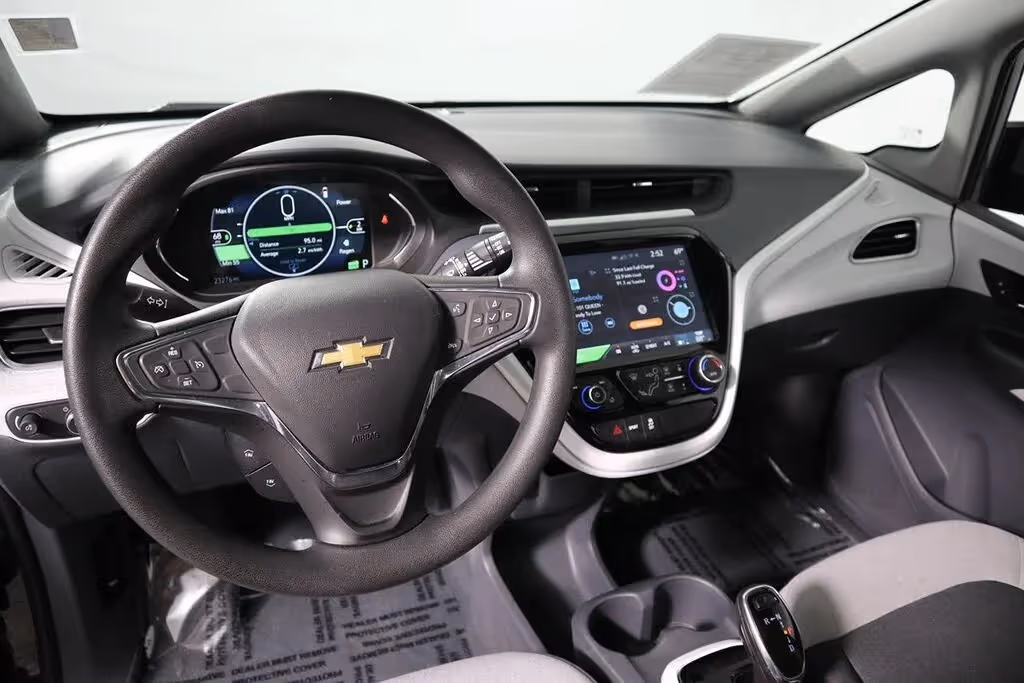
In this article, we explore the dashboard of one of the hottest selling EVs on the market, the Chevrolet Bolt. In reality, the dashboard is not dissimilar from that of an ICE vehicle, but understanding how it works can help make the most of day-to-day operation. Plus, it has the potential to make you a power user, allowing you to get incredible range and efficiency from your car.
Basics
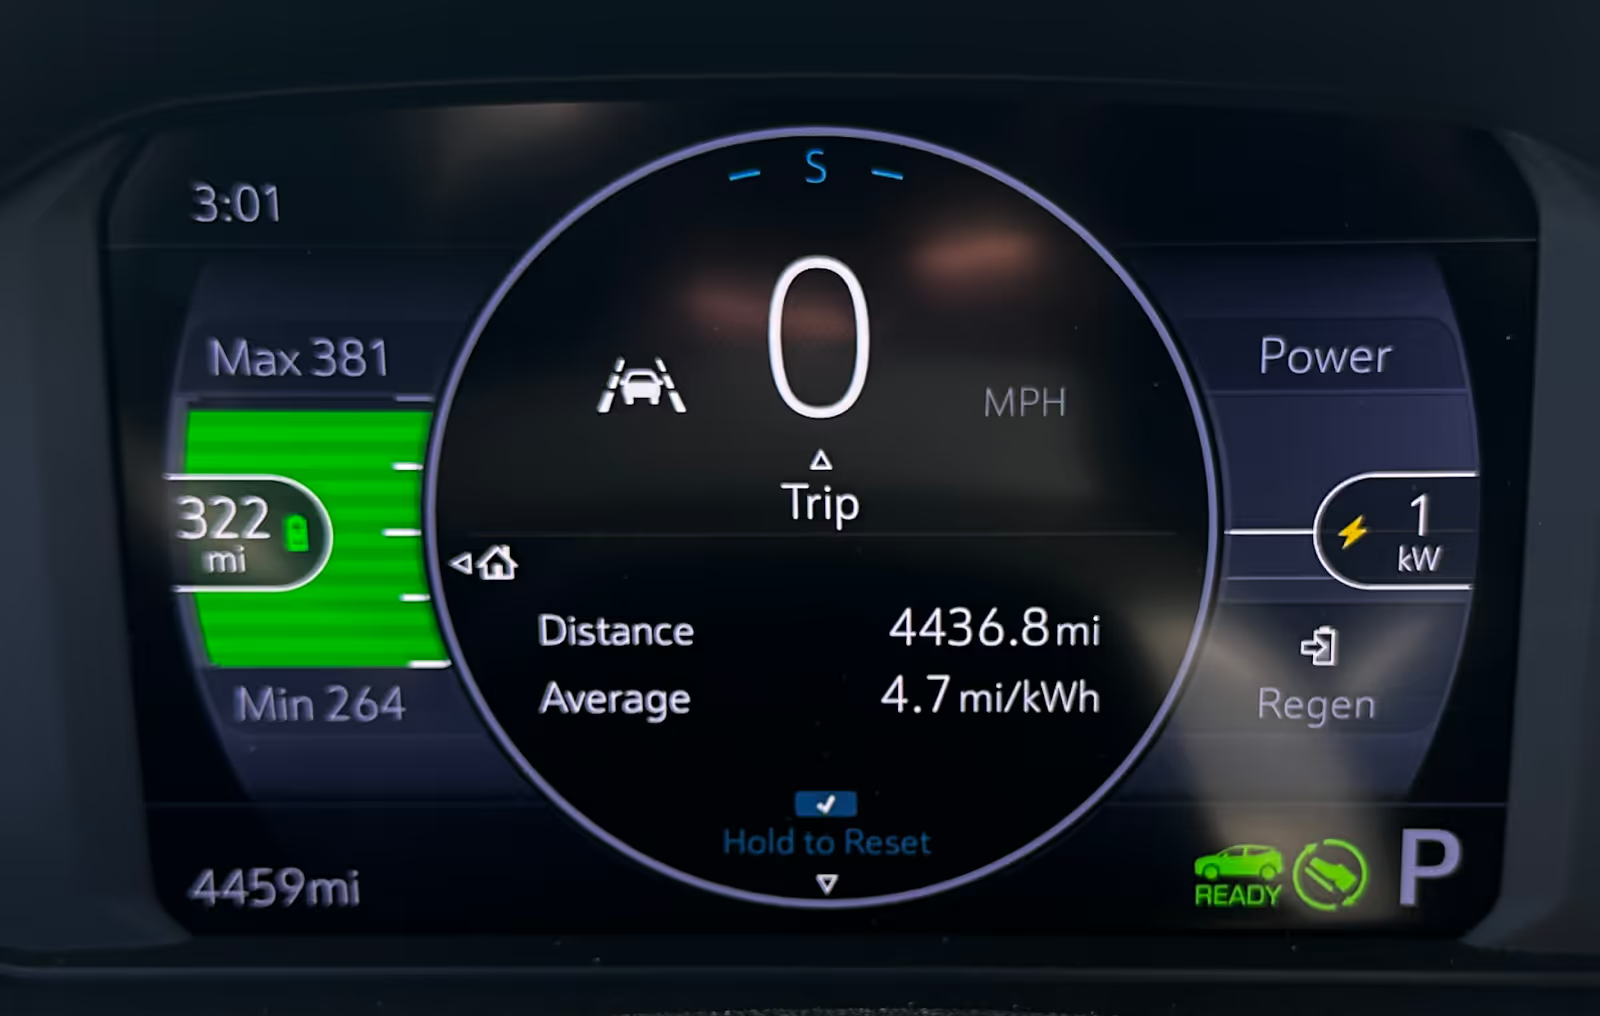
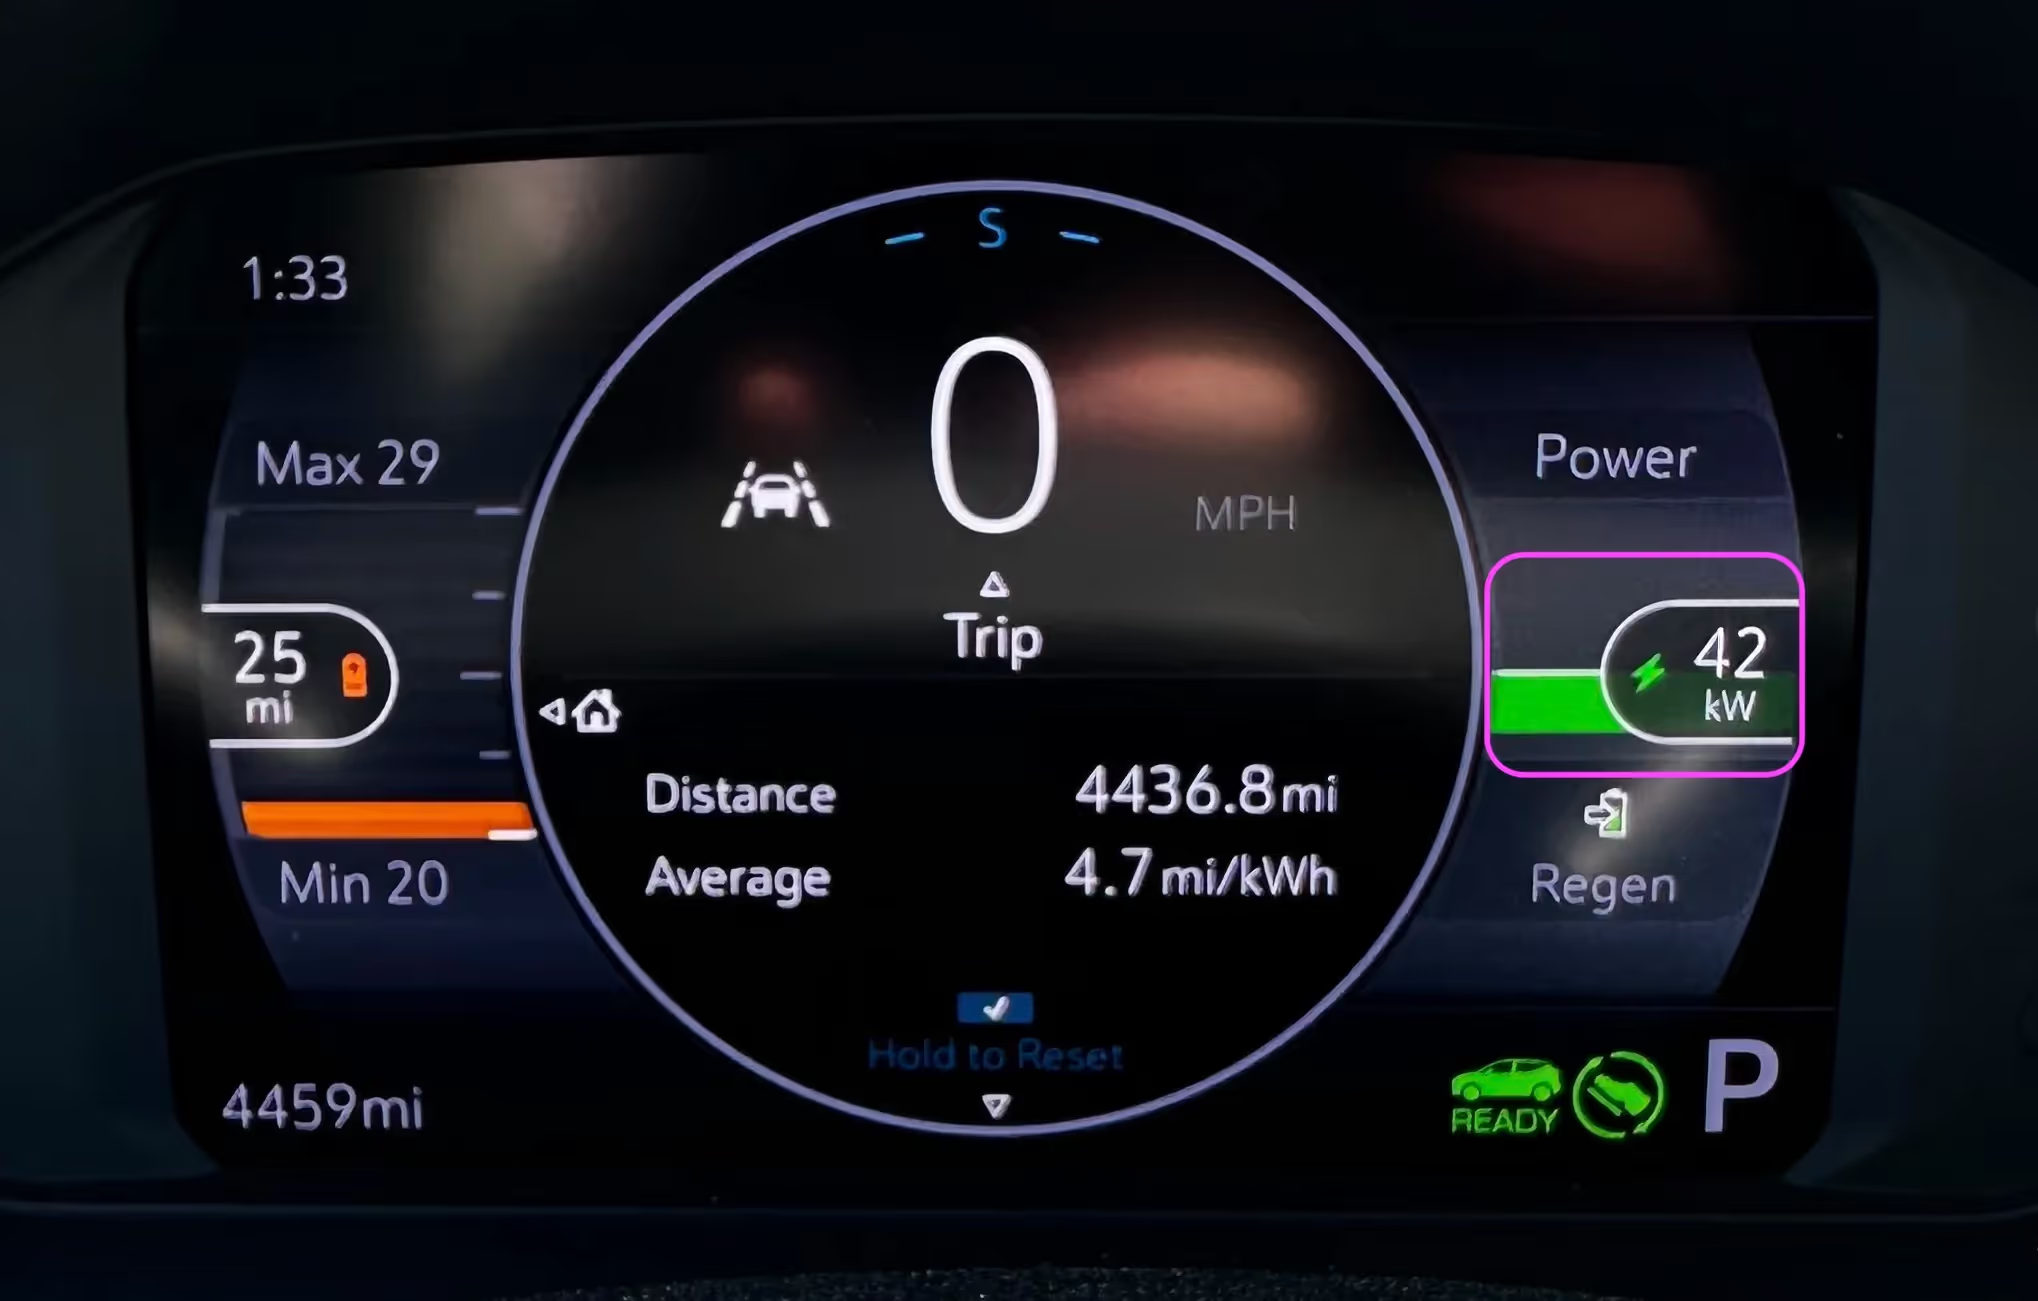
The dashboard of the Chevrolet Bolt provides many of the basic necessities that one would expect, including total vehicle mileage, time, and a speedometer. However, some unique features are also included. This is the dashboard when you're parked.
Let’s start on the left-hand side of the screen, where there is critical information about the state of the battery. The middle number on the left displays the current estimated range if the current driving conditions are maintained.
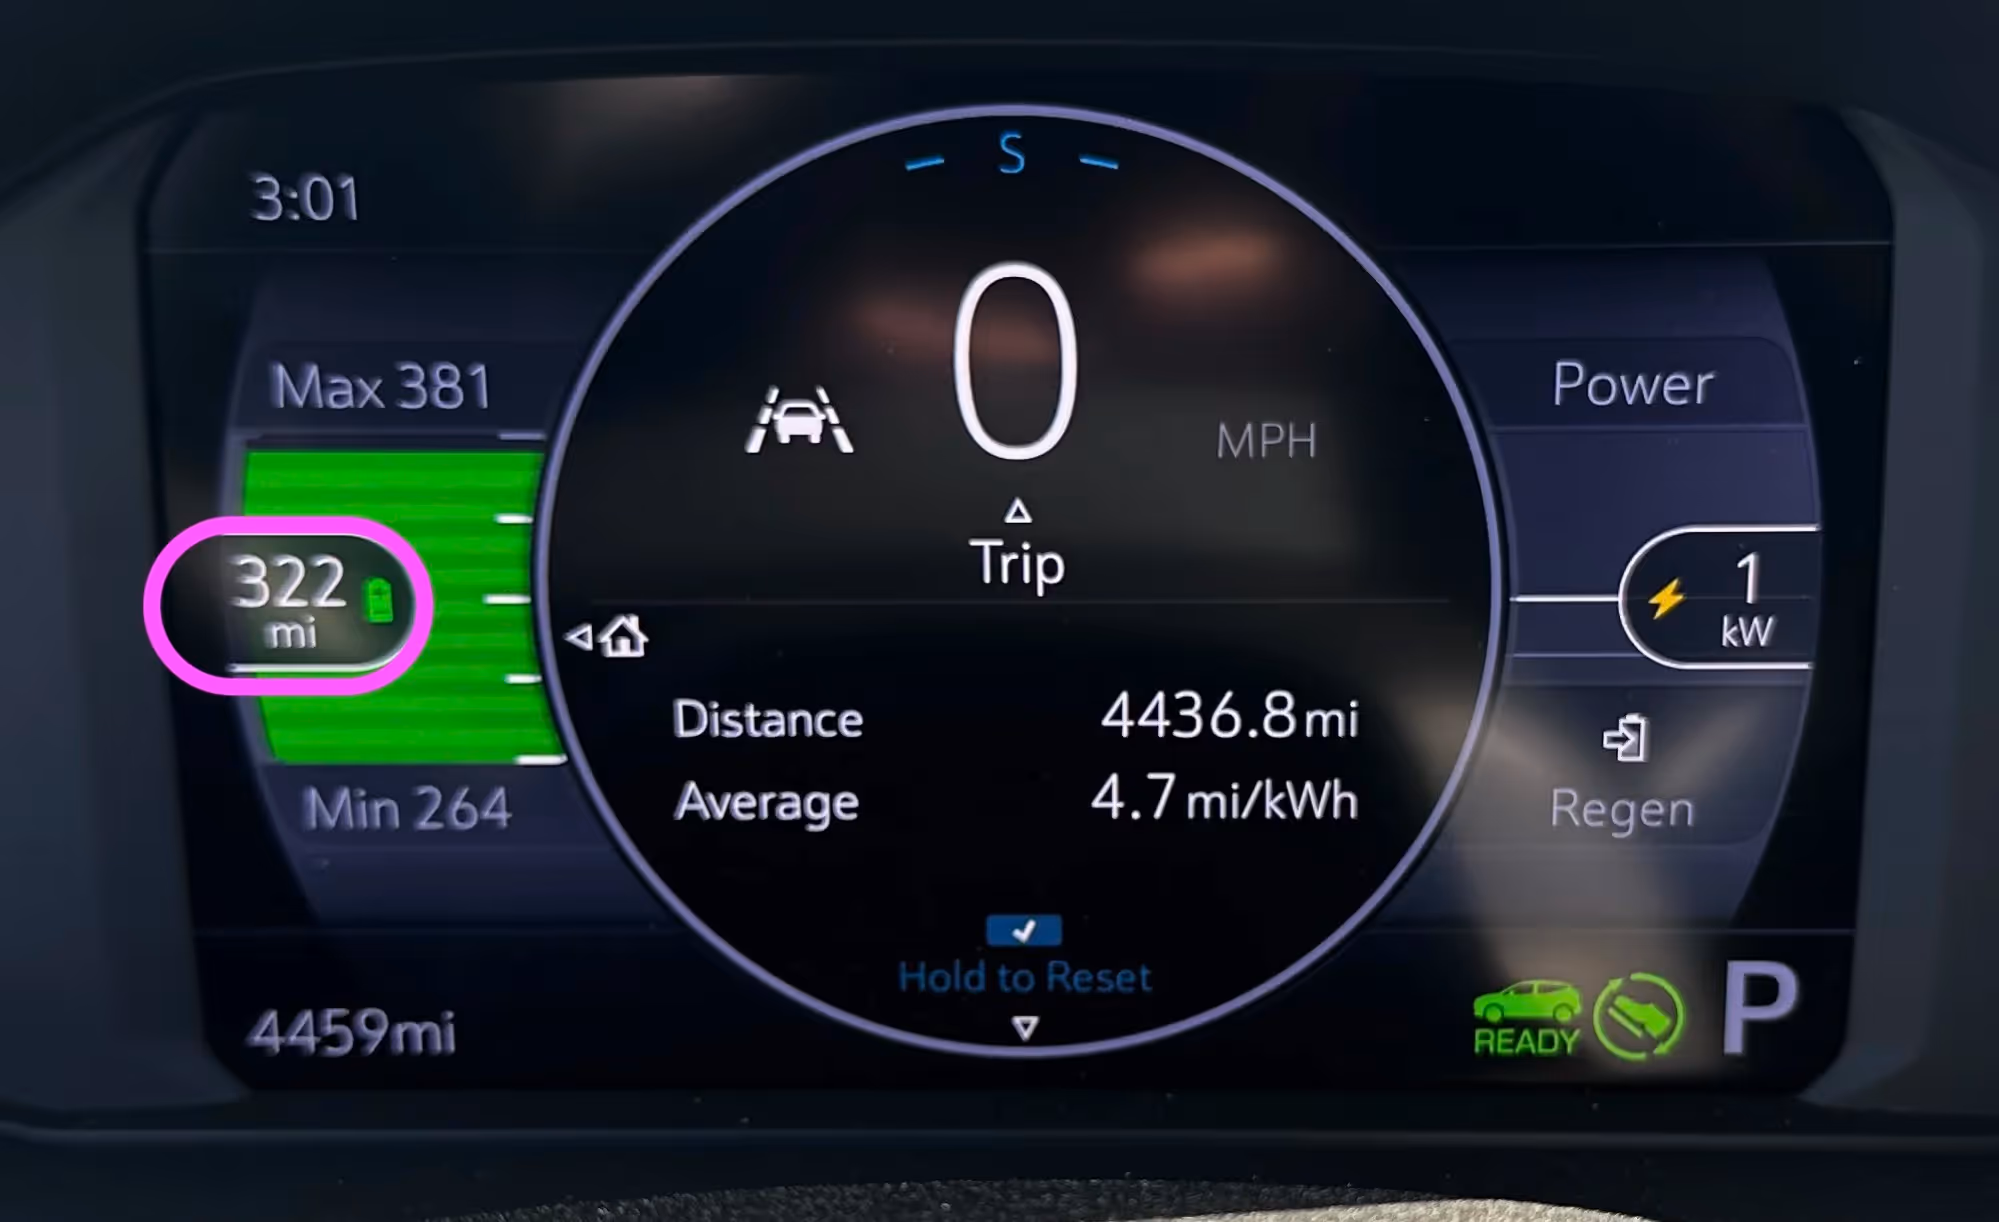
It’s important to note that this number is an estimate based on the way you’ve already been driving and it may not represent that range you can expect on the rest of your drive. Driving on a highway vs. streets, uphill vs. down, and in different weather conditions can all impact your actual range. If your drive requires you to drive 25 miles on city streets to get to the highway, your predicted range for those first 25 miles will likely be overstated for the highway portion.
On the same side of the dash, the upper and lower numbers represent the extremes, or the best-case and worst-case range based on recent driving conditions.
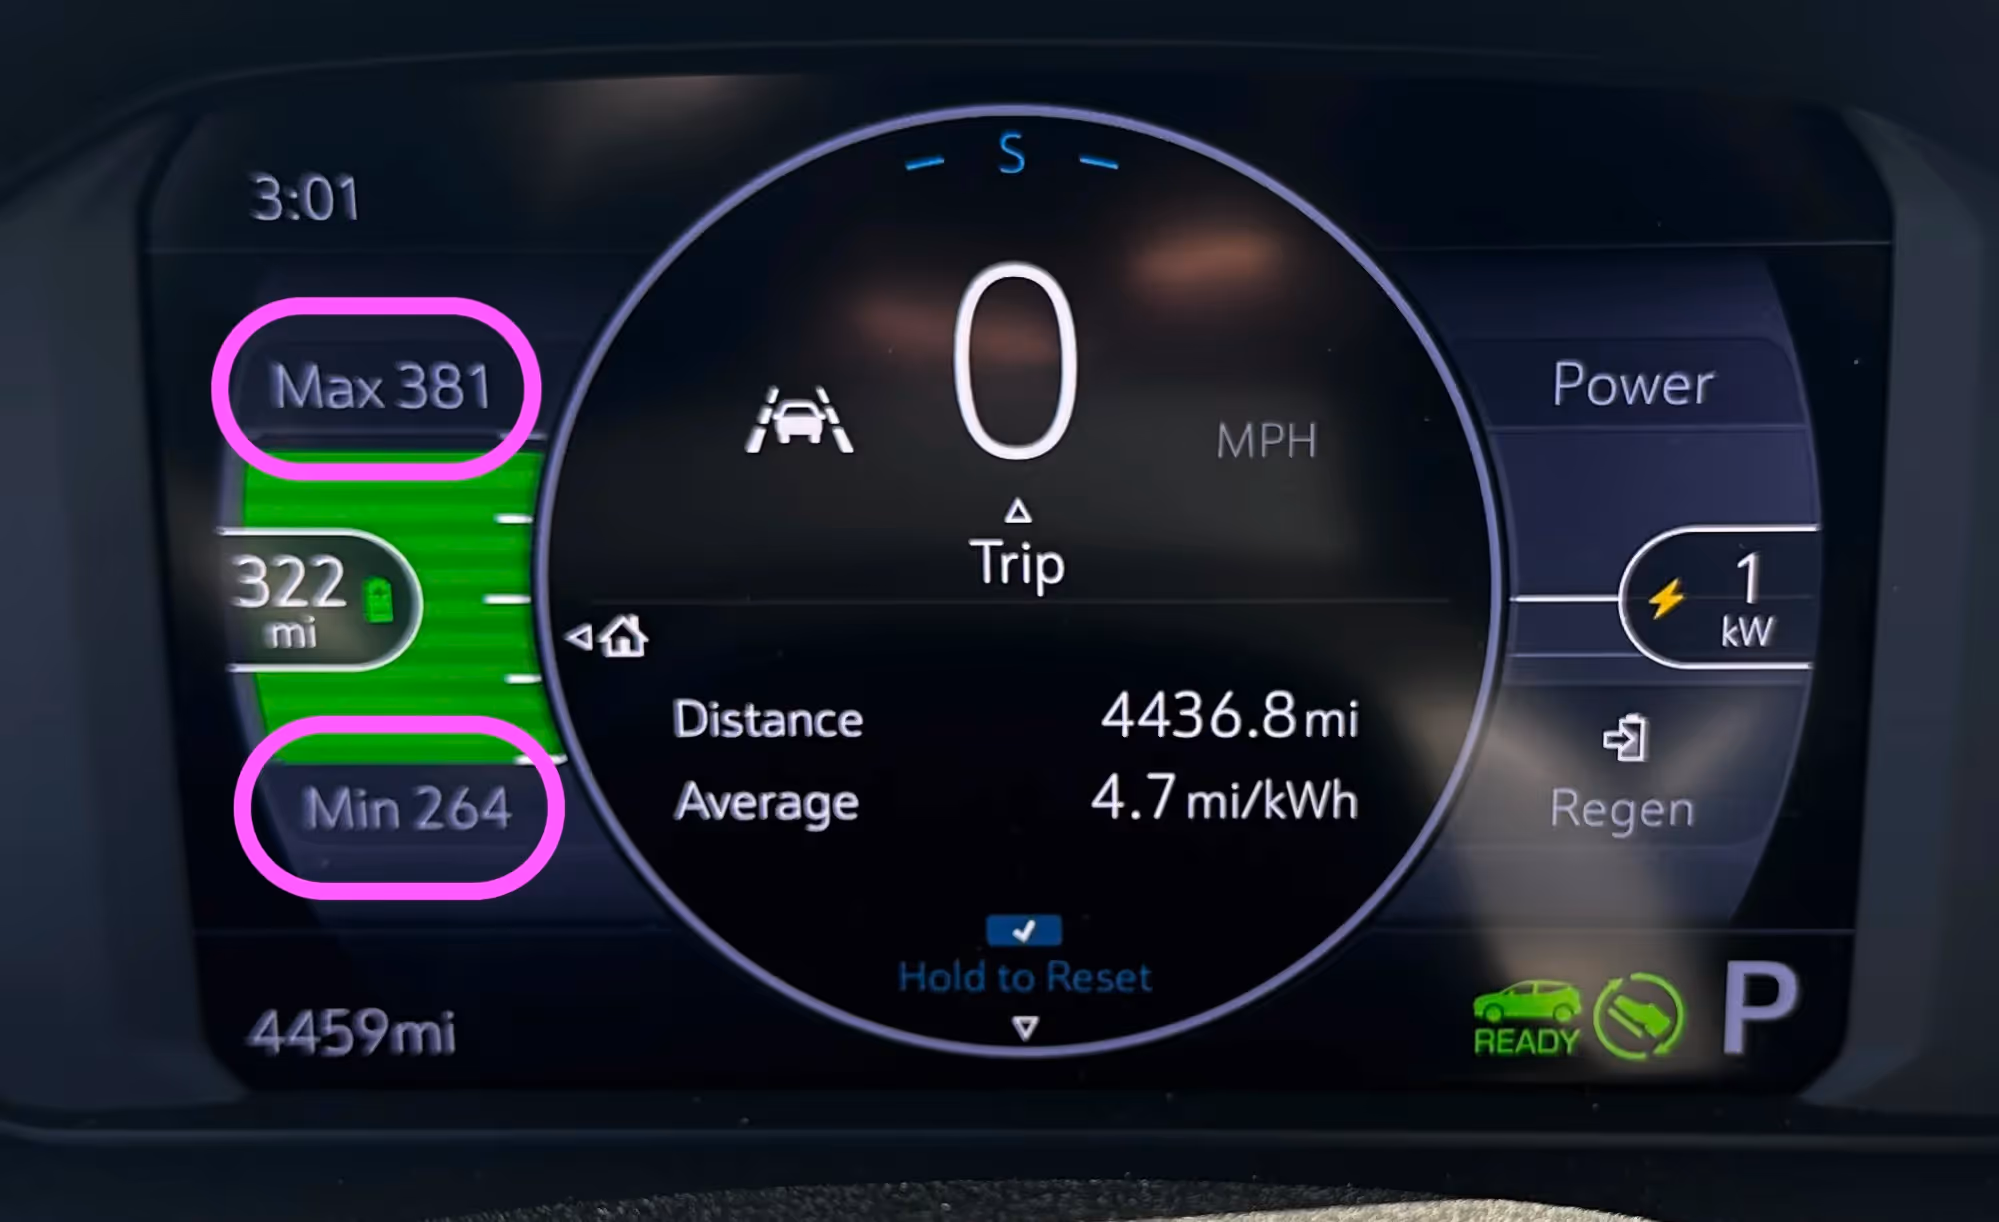
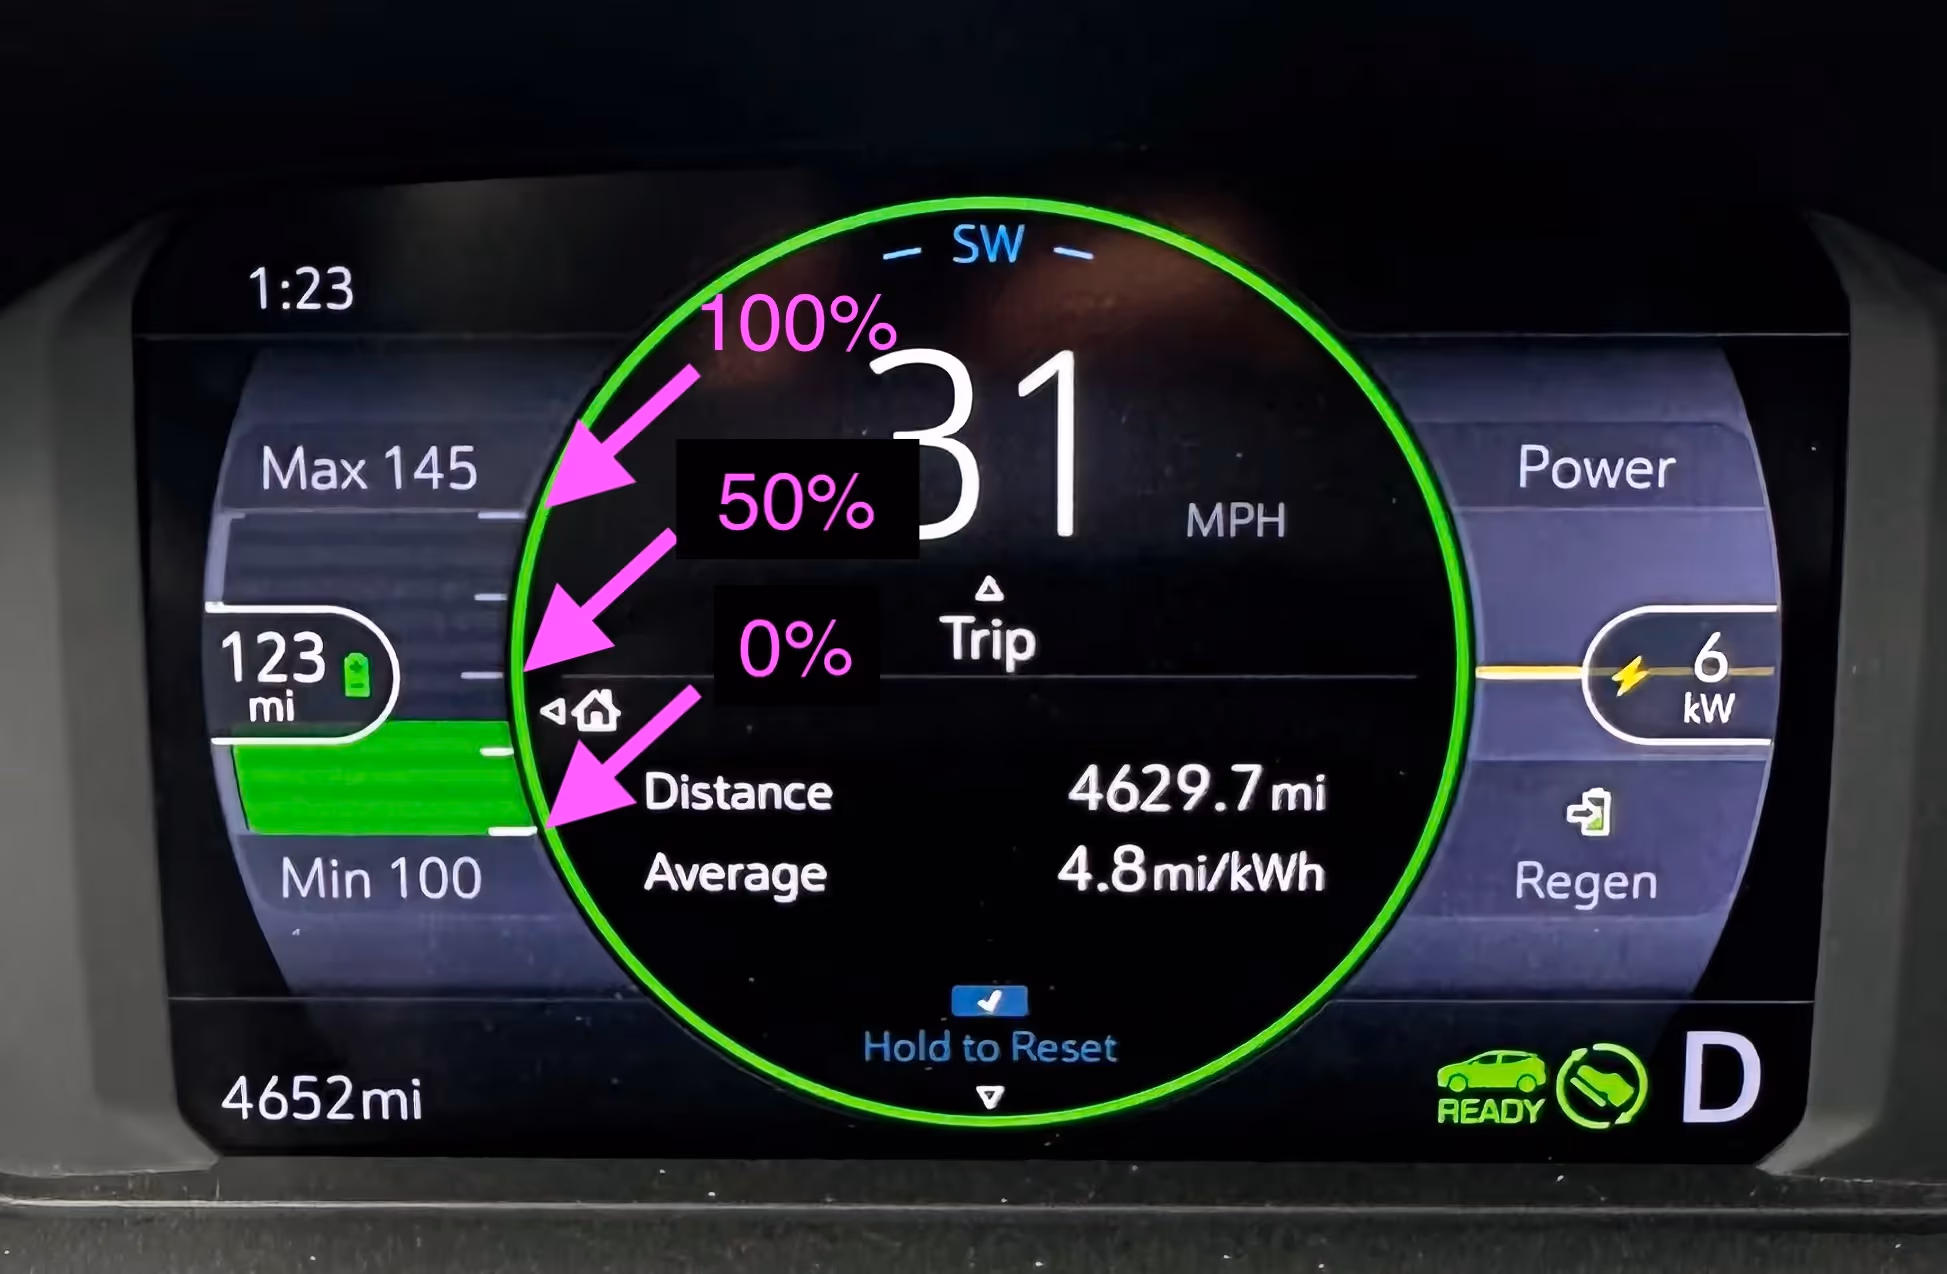
Unfortunately, on this dashboard, a digital readout of battery percentage is not available, but can be estimated from the green bars: white hash marks are at 0%, 25%, 50%, and 75% of battery capacity. However, the specific battery percentage can be seen from the MyChevrolet app, using the mobile app or Apple CarPlay.
In the center of the screen, the trip meter lists total distance and the average efficiency in miles per kWh for the current trip. Note that a new trip only starts when you manually reset it - turning off the car will not do it.
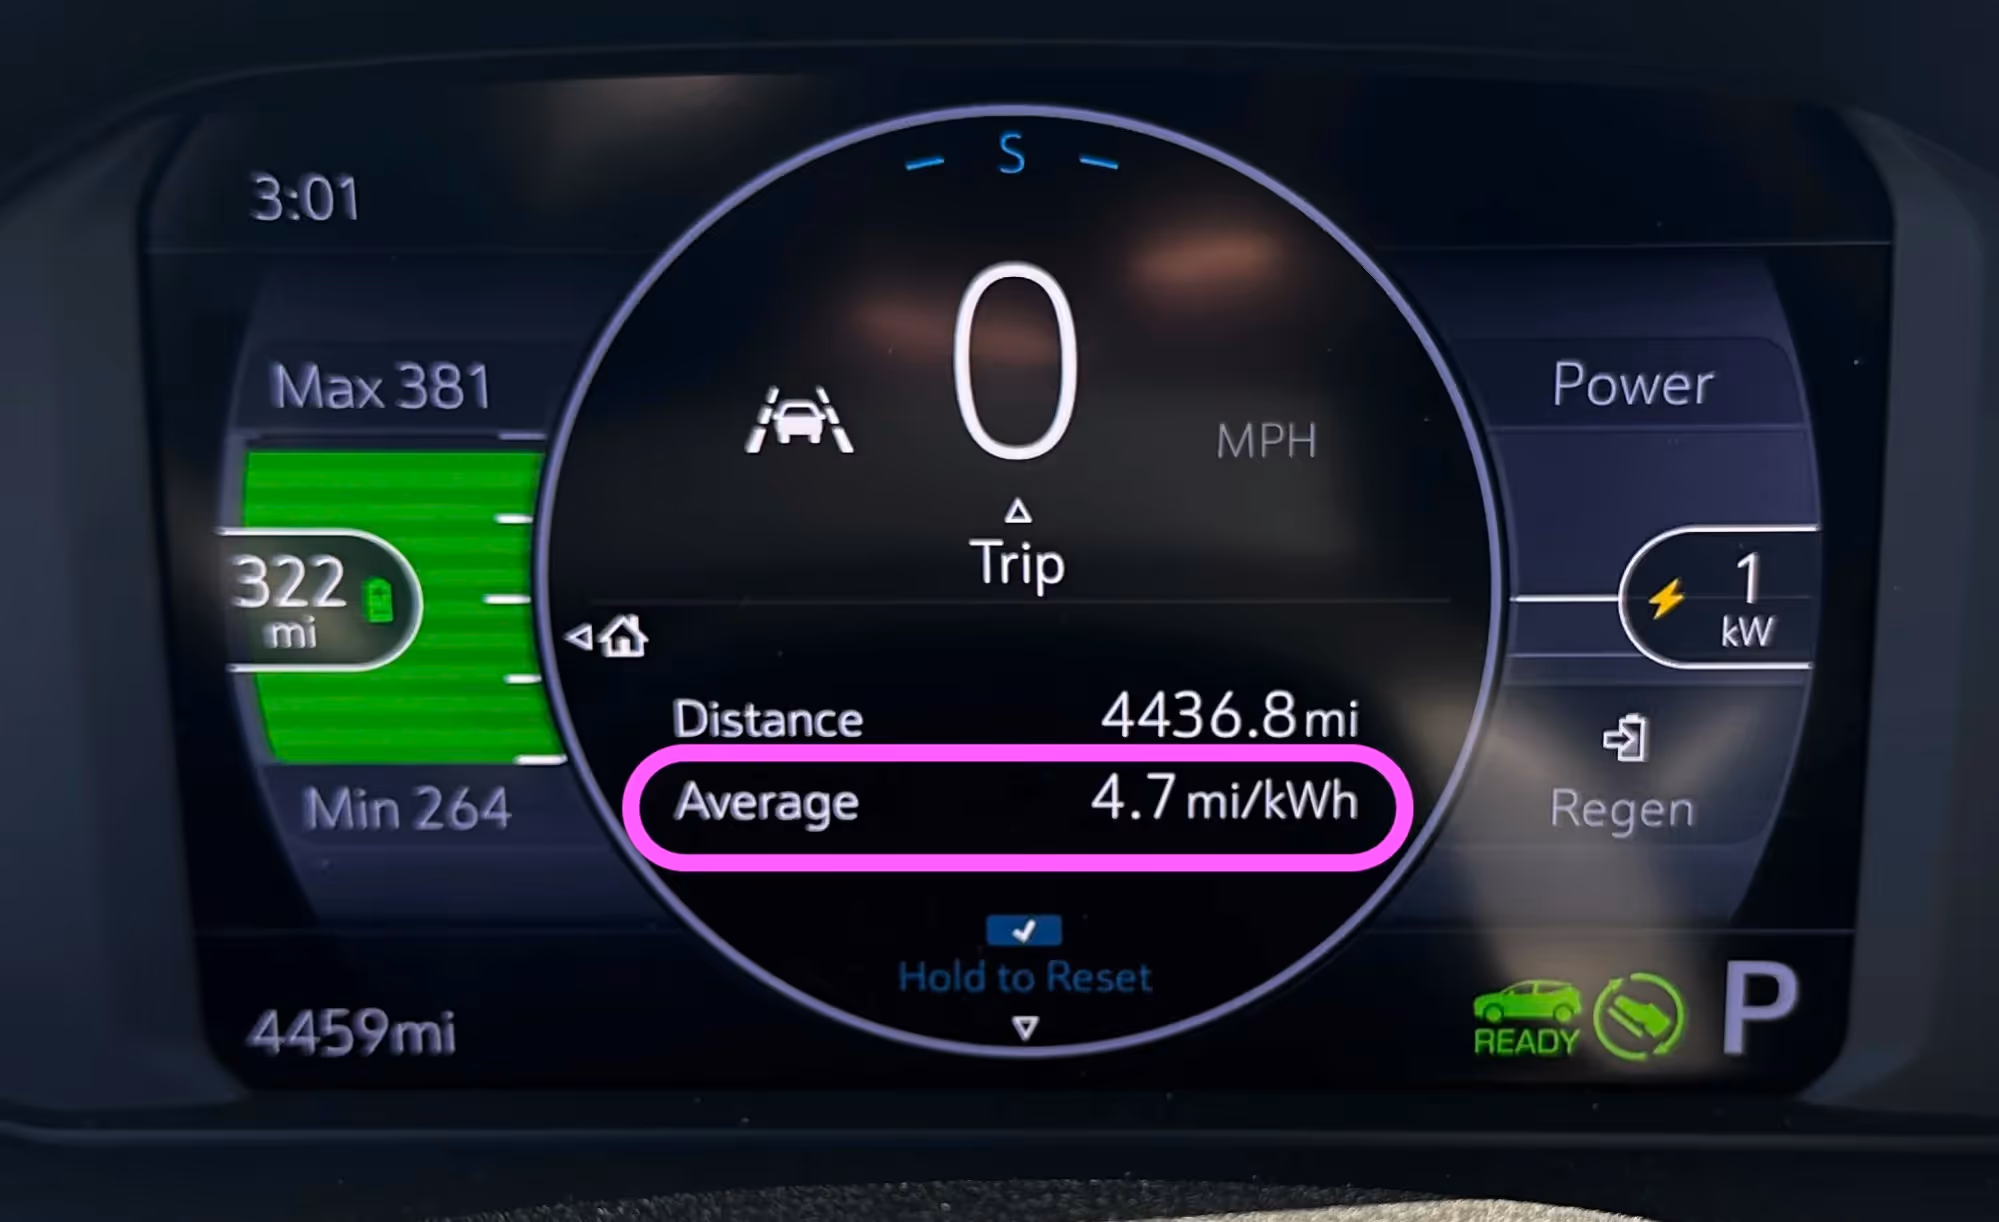
Trip efficiency can be used to track efficiency for specific routes, drive durations, or if you’re doing efficiency experiments. To determine total expected range when fully charged, multiply this average efficiency by the battery size. In this case,
4.7 mi/kWh x 66 kWh = 310 miles
This trip efficiency of 4.7 mi/kWh is for the current trip. This number works differently than the left-hand range predictor we talked about above, which uses driving conditions for the previous 20-50 miles (although the exact calculation is unknown). The range predictor updates pretty frequently, especially on long trips, while the trip efficiency will recalculate only when you reset the trip. This can cause a bit of a mismatch sometimes. In the example, the battery is roughly 95% charged, putting the estimated efficiency closer to 5.1 miles/kWh (322 miles divided by battery capacity of approximately 62.7 kWh)
Power Usage
On the right-hand side of the screen, the power output is displayed.
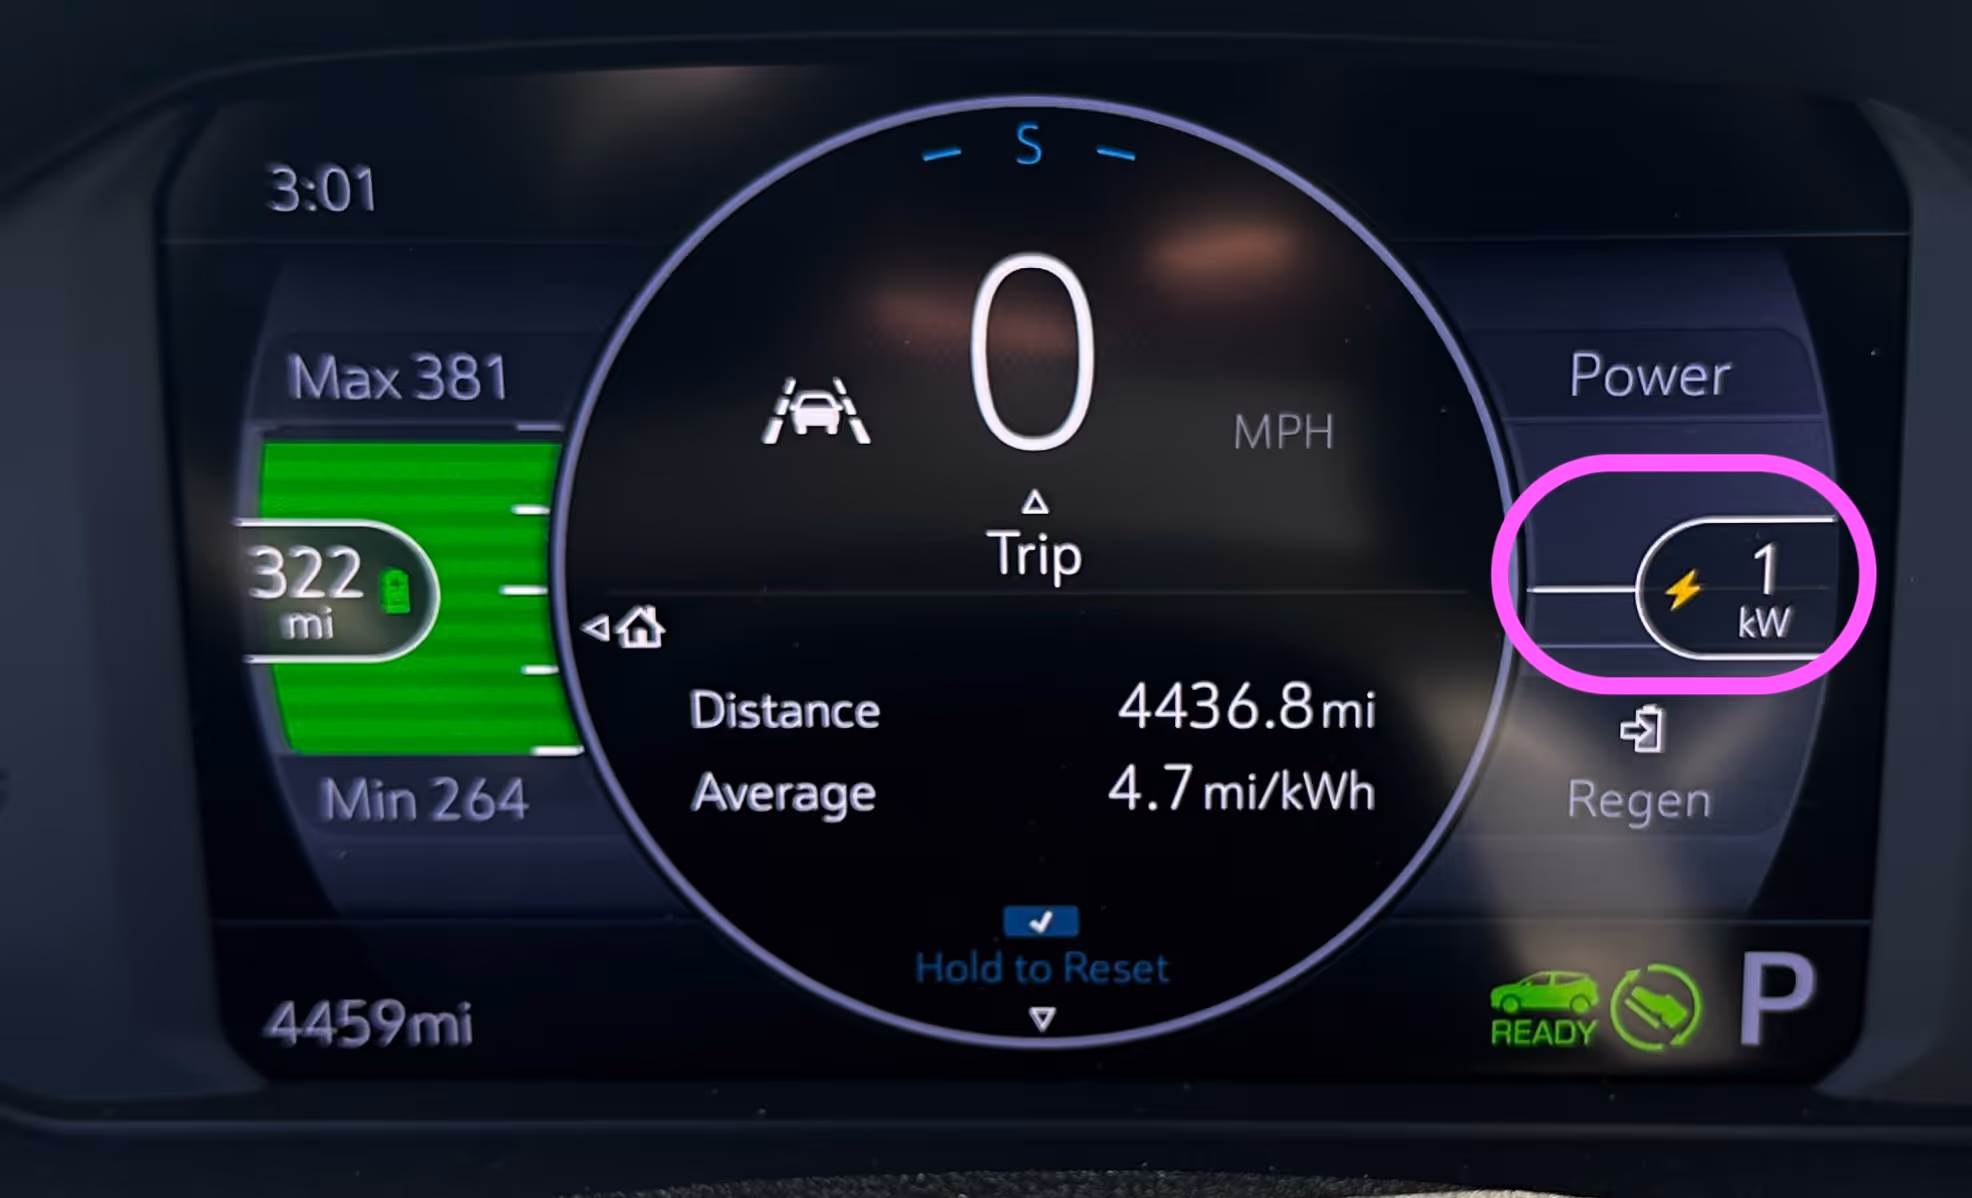
With the car ‘idling’, the power output is 1 kW. This means if we leave the car idling for an entire hour, we would use (only!) 1 kWh of battery capacity. In reality, the power display is not very high resolution, so it’s likely that the usage is far lower (closer to 0), but the system rounds up.
As a note, this is one major advantage EVs have over ICE vehicles. Combustion engines burn significant amounts of fuel while idling and pollute a lot. Meanwhile, if you’re stuck in bumper to bumper traffic in an EV, you’re not using much of your battery at all and producing zero tailpipe emissions.
Charging
When charging the vehicle, the power meter will indicate energy flowing into the battery with a green bar. The charge rate is displayed in kW, which is how fast the car is charging. The Bolt charge rate peaks at roughly 55kW, but users often only see 40-45kW, depending on conditions. At this speed, the battery will refill 42kWh in one hour of charging. However, the charge rate does not stay constant, but instead drops quickly as the battery capacity crosses 50-60% SoC.
Driving
While driving the vehicle, the power meter will indicate that energy is flowing out of the battery with a yellow bar. In the example on the left below, the power output is 46kW, or roughly 25% of the available power for the Bolt. This is common during the acceleration phase, when the vehicle is getting up to speed. Once the desired speed is reached, the power output needed to maintain the speed drops significantly, as can be seen in the example on the right.
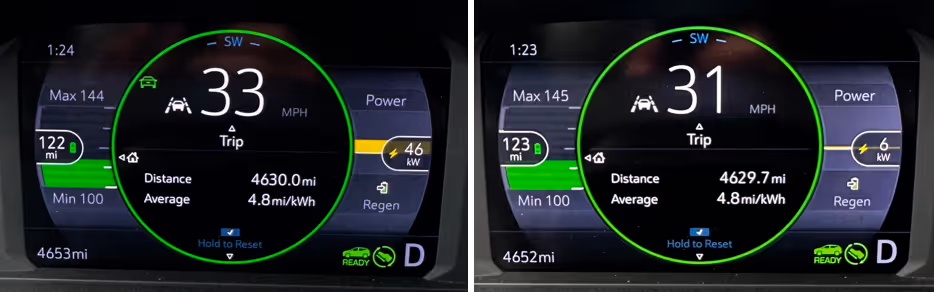
One thing that is missing from the dash is instantaneous efficiency, which would tell you how much energy you use to accelerate vs. drive at a steady state. To quickly determine this value, you can divide the speed (mph) by the power output (kw). In the case on the left, the efficiency is only 0.7 miles per kWh, which is very low. On the right, the efficiency is more like 5.1 miles/kWh - which is very good. In combination with the left-hand range predictor, being able to calculate efficiency in real-time can be used to maximize range and vehicle efficiency under various conditions.
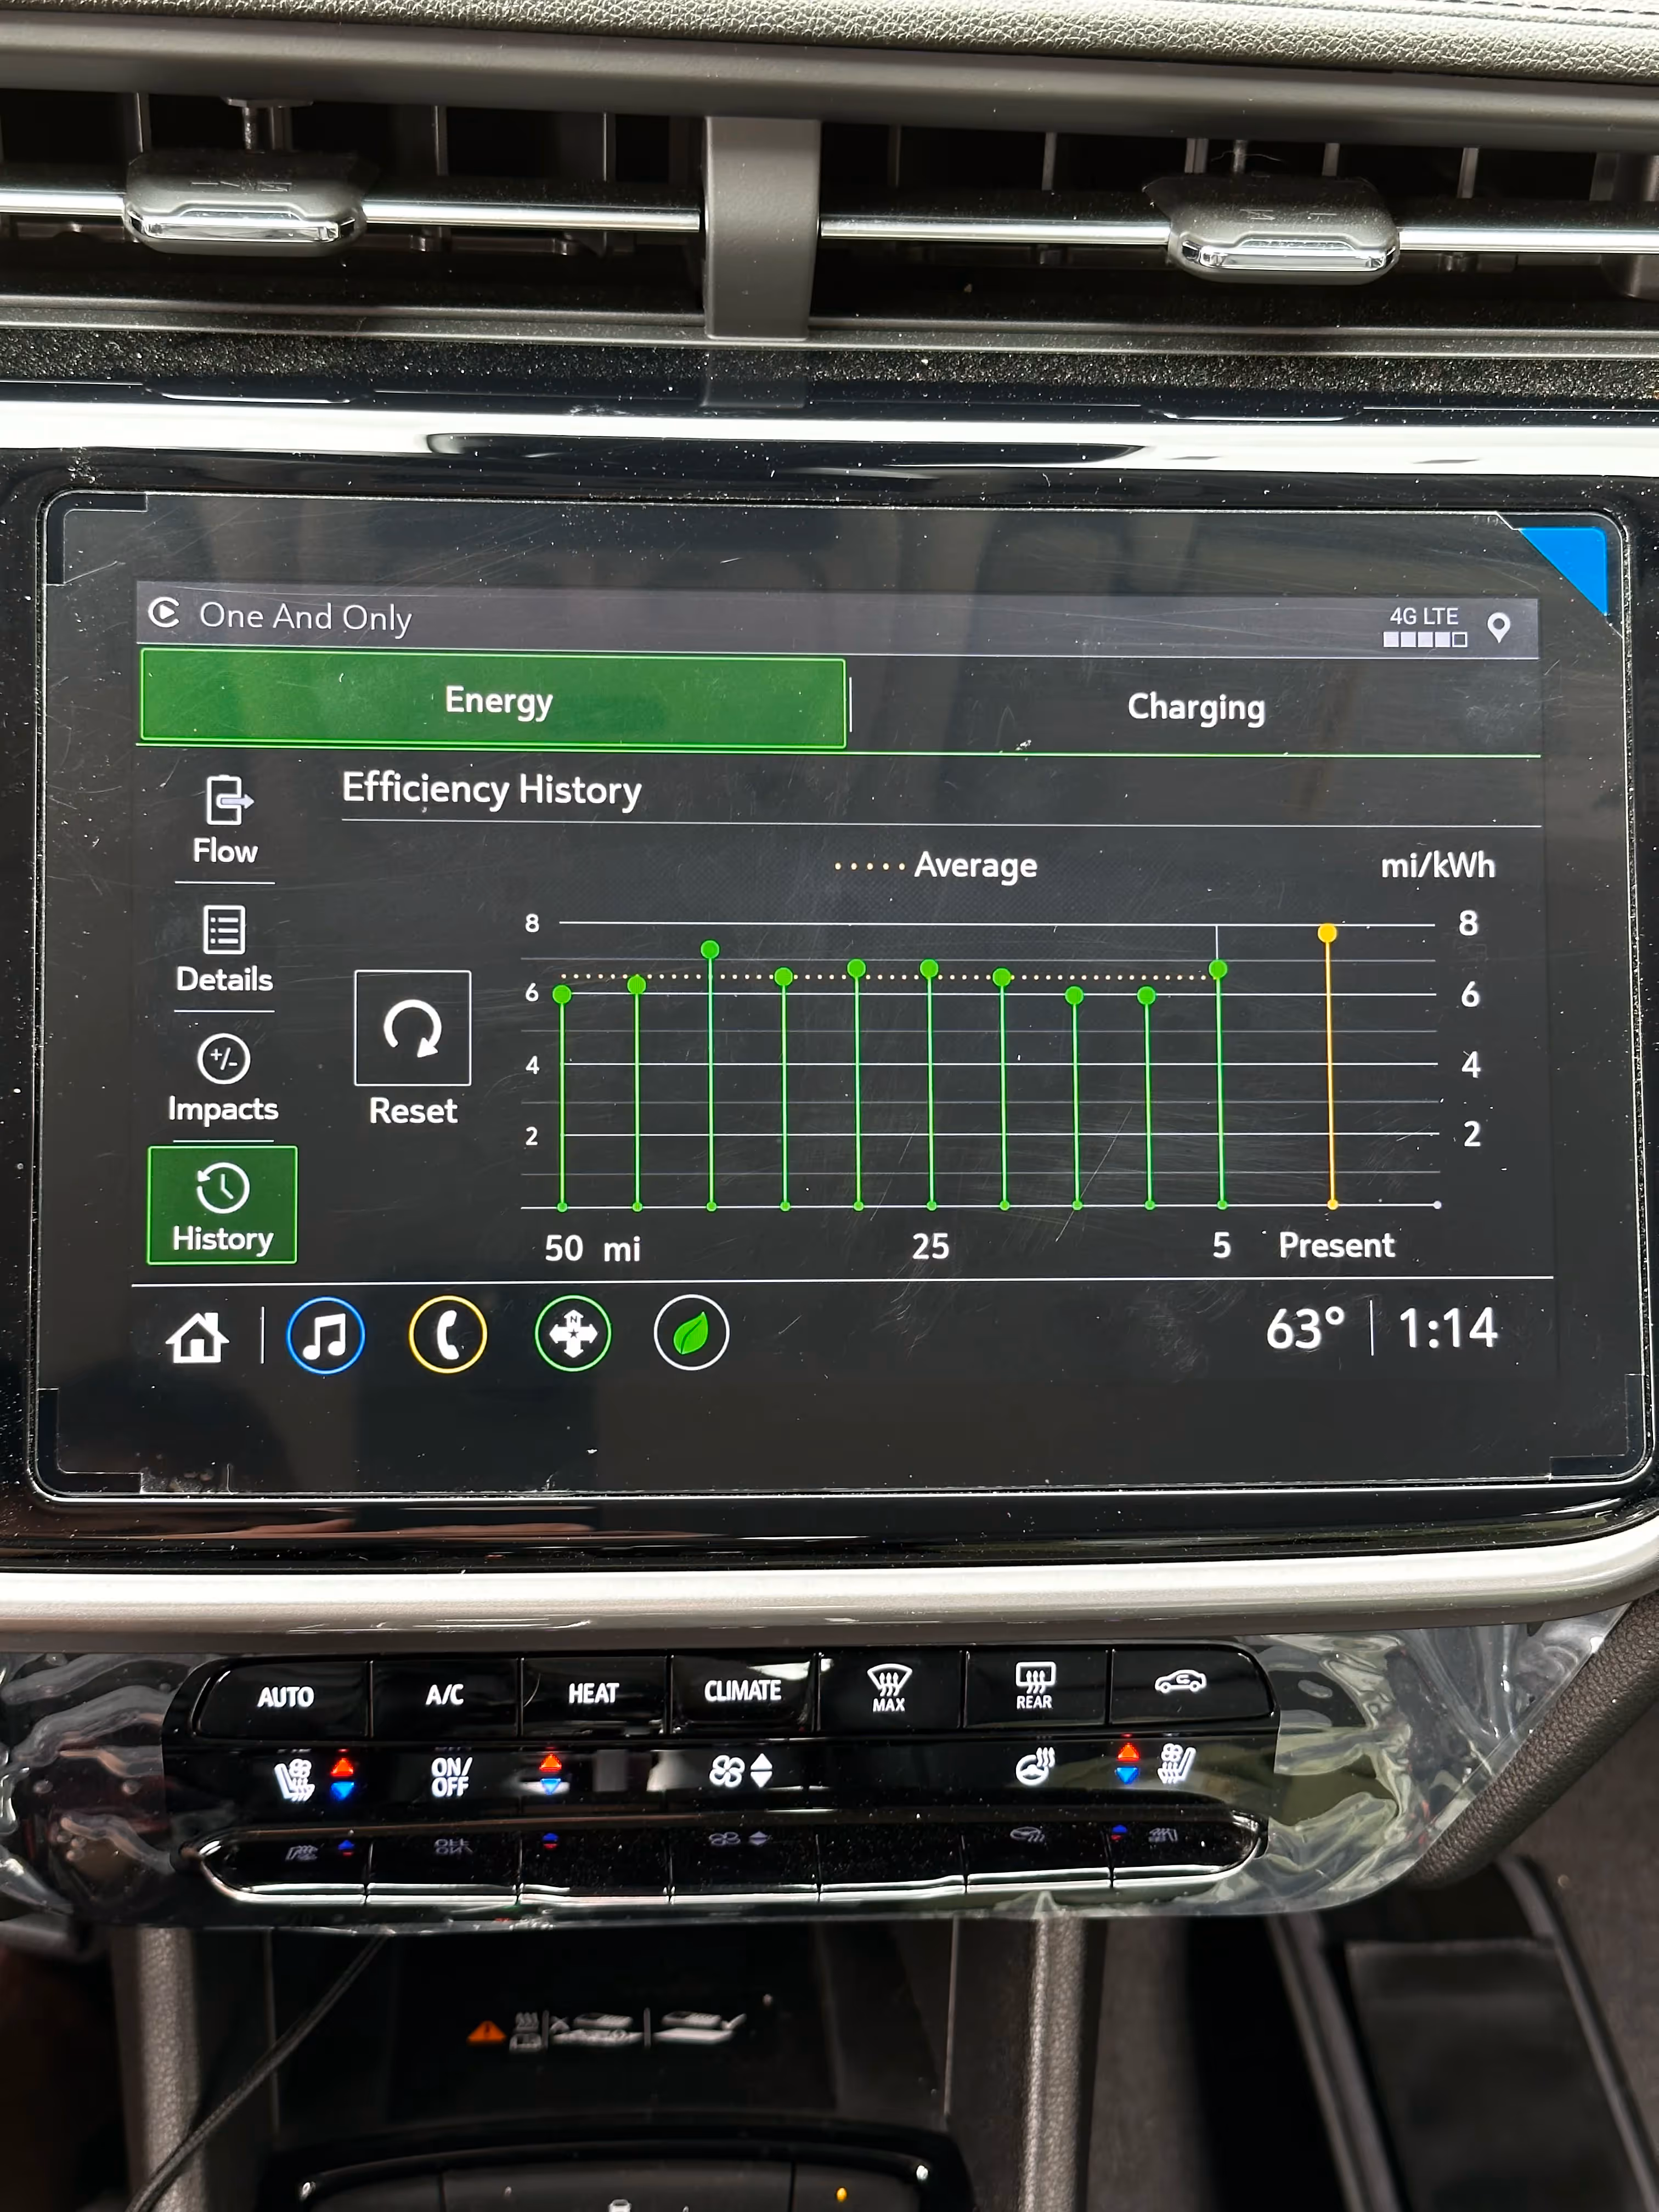
In addition to the dashboard, EVs typically contain additional information in the infotainment system, which is also where things like music and temperature controls are. Shown here is the energy tab on the infotainment system of the Chevrolet Bolt.
This screen displays the efficiency (miles/kWh) over the last 50 miles, in 5 mile increments. In contrast to ICE vehicles, which typically do not offer such detailed efficiency data, access to this data can provide insights into driving style and how to improve range. As you can see in the picture below, EVs are capable of incredible feats of efficiency when taking advantage of regenerative braking, reducing absolute speed, and minimizing additional energy demand from inside the cabin (e.g. using heat).